Before anyone gets excited about GDP returning to 2008 levels (as is likely to be announced tomorrow) can I refer to this table issued by the ONS on 2 July:
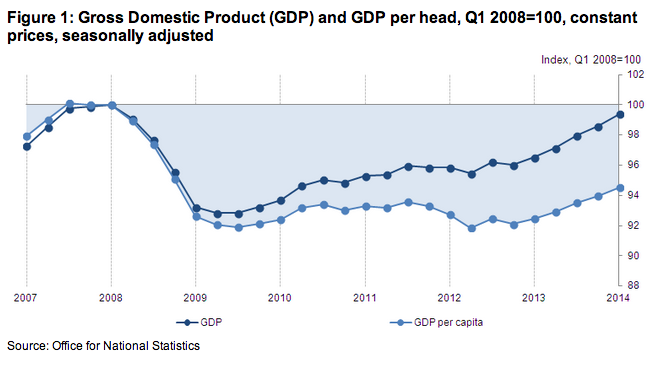
The point is an obvious one: even if the absolute level of GDP has returned to the 2008 level GDP per head has not. It is at no more than 95% of 2008 level. And that means almost everyone in this country is still worse off than they were in 2008. That's nothing for the government to celebrate.
Thanks for reading this post.
You can share this post on social media of your choice by clicking these icons:
You can subscribe to this blog's daily email here.
And if you would like to support this blog you can, here:


and that’s without factoring in growing inequality. if the BOE are waiting for wages to pick up before raising interest rates then i reckon they’re in for a long wait.
also there’s a good story in the Independent RE yet another Tory donor involved in tax dodging on a massive scale. and HMRC turning a blind eye, as usual.
link: http://www.independent.co.uk/news/business/news/the-tory-donor-whose-firm-is-one-of-britains-biggest-tax-avoiders–with-hmrcs-blessing-9624358.html
We know where the other 5% has gone, i guess.
And not forgetting the cumulative effect of modest growth foregone by the imposition of unnecessary austerity
At least the UK is recovering, slowly but its getting better. It could be worse, some countries are in real trouble.
So might we be still
Wait until interest rates rise
But at least we will be starting from a better spot.
Absolutely correct Richard. In any case, given a long term GDP growth rate of (say) 2 percent, returning to 2008 levels in 2014 means we’ve lost 12% of GDP compared to where we would have been if the economy had grown at trend over the last 6 years. And throughout that whole period, real wages have been falling. It’s a dismal picture to be sure. Well done ConDems… NOT.
I am constantly perplexed as to why people refer back to the halcyon days of 2007/08 when looking at today’s figures. Surely the financial crisis confirmed the obvious, that a lot of the growth and wealth accrued in the years leading up to the crash was illusory.
But some of the growth of GDP was caused by people borrowing on credit cards and mortgages. There wasn’t much real growth during the previous 5 years before the recession. That’s been one of the major problems we are suffering from. That’s why debt levels are so high, that’s why the banks are going to get some real hits (with bad debt) in the next few years.
The disparity between the National and per capita GDP figures highlights a point I made some time ago, namely, that the increase is due to a large-scale asset transfer (through the vehicle of cheap credit) from the private individual to corporate bodies. The Government have almost succeeded in recreating the perfect storm conditions of 2007/8, except this time the populace are starting from an even lower base. That transfer will become an asset seizure when interest rates inevitably rise (see Carney’s warning this week) with much of the State’s ability to take the strain diminished or disappeared. Incredibly, Osborne has managed to translate the boom/bust cycle into a tool for asset-stripping and impoverishing the population. It will make no difference which party is in power in the real sense.Labour will be in no position (even if they had the will) to restore what has been destroyed or damaged (NHS devastated, DWP in dissaray , Energy, Education in crisis etc etc.), in timely order. Nor will they be able to resist the rise in interest rates. (The term poison chalice springs to mind).
Given who Cameron, Osborne et al really represent I would suggest, Richard, that this Government has much to celebrate.
“GDP is measured in three ways. Output, which is the value of the goods and services produced by all sectors of the economy. Expenditure, or the value of the goods and services purchased by households and the government, and income, which measures earnings, mostly via wages and profits on investments.”
Does this tell us anything about the appalling levels of debt and leverage households and firms are in? Even more importantly-does it tell is anything about the appalling externalities (externalities as far as I’m concerned) created in the process?).
The needs to be a GDP figure for infantilism-that would be off the chart in an upward direction.