The Office for Budget Responsibility has published its analysis of the coronavirus (to date) today. I will do a number of blogs on what it has to say. The most important thing I will say is that what the Office for Budget Responsibility is saying is almost always wrong, or fails to draw attention to the truth at the very least.
Take this for example:
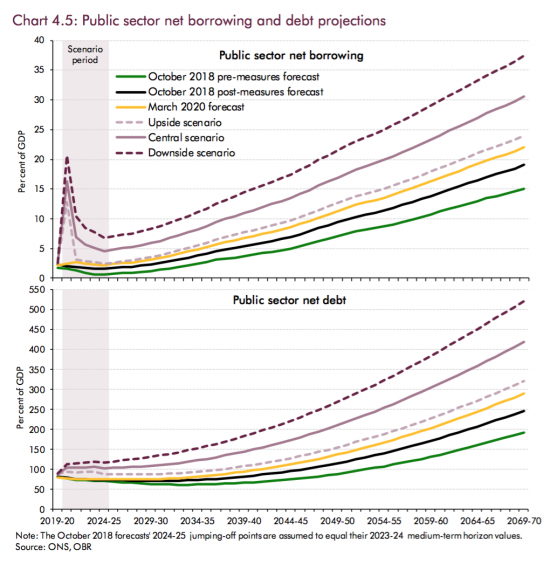
The above charts summarise the OBR's long term forecast for the UK, and the FT has already picked up that they are forecasting national debt of 400% of GDP by 2070.
But that's not true. Any more than their current debt figures are true. It's straightforwardly wrong to claim that we have over 100% of national debt to GDP now when about one-third of UK national debt is owned by the government at this moment. There is no debt to repay in that case. And if there is nothing to repay there can be no debt, and nor is there an interest charge. But still the OBR, along with the FT and the likes of the Institute for Fiscal Studies pump out stories about the impossibility of debt burdens when the simple truth is that if debt gets anywhere near the above levels then almost all of that debt will be owned by the government at no direct cost to anyone.
I so no direct cost for reason. Because there is one cost. That is because the government has injected considerable amounts of cash into the economy: that much I agree. The money in question is also technically a liability on the Bank of England's balance sheet, like all bank deposits are in many bank's accounts. And I'm even going to agree that there is a cost to this, but which is not really from interest (which I will come to in another blog, and where I acknowledge that for policy reasons 0.1% is paid) but for reason of the social consequence of this.
The government's injection of cash into the economy has massively increased the current savings ratio. The forecast is that it will stay significantly higher than in the recent past:
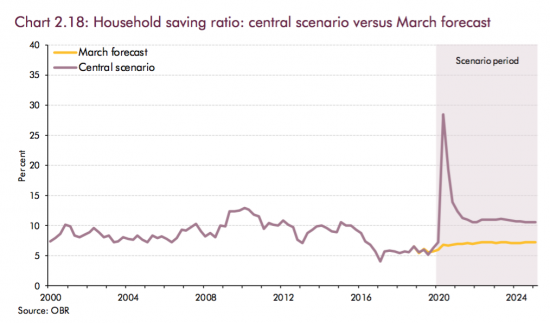
As I have long predicted, people are not going to be in a rush to spend after this crisis, and I suspect the OBR forecast is too optimistic in the sense that I suspect the savings ratio will be higher than they predict. But what this means is this when it comes to the sectoral balances:
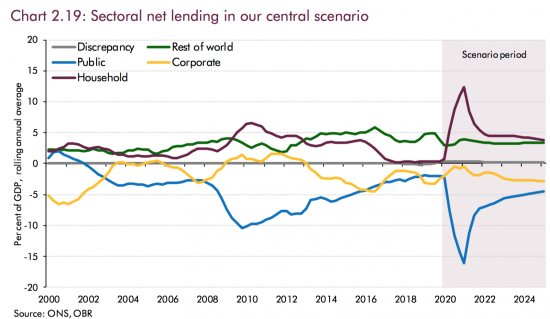
The sectoral balances work on s straightforward logic. It is that in sterling the books of account must balance. And there are just the four sectors shown which cover all economic activity (and as a matter of fact, they do).
The OBR is forecasting that Brexit will have no impact in the overseas sector's willingness to hold sterling.
They rather optimistically think that business is going to be borrowing to invest after Brexit. I have no idea why they think that, but they do.
But the telling lines ar the blue (government) and maroon (household sectors). What the government is borrowing is the sum that households will be saving.
So the question is, where did the money that the household sector is now saving come from?
And the answer is, of course, from the money injected into the economy by the government in the first instance. Where else could it have come from in the middle of a crisis? Literally nowhere, according to this data, and as a matter of fact.
So what is actually happening is that, exactly as modern monetary theory says, government cash injections create private saving. And when the government injects money into the economy private wealth increases. The government has done that through QE and not debt, but there's still more money, and the reality is that as this chart shows a great many people will have a great deal more savings as a result.
So is there a cost to all this? Undoubtedly there is. But it's not to the government, where interest costs are falling. It's to society at large as inequality grows. That's the side effect of this crisis.
Add this to the list of ethical concerns to be addressed by modern monetary theory, which it alone is capable of addressing, as already mentioned this morning.
If only other commentators would raise such issues.
Thanks for reading this post.
You can share this post on social media of your choice by clicking these icons:
You can subscribe to this blog's daily email here.
And if you would like to support this blog you can, here:


[…] for those fetishists. And yet, within it are the true stories, which I have already been noting, here, and […]
Chart 4.5 is in fact wrongly labelled. It says ‘Public Sector Net Debt’, and ‘Public Sector Net Borrowing’, but Net of what? If it was generally Net of internal borrowing then it would exclude the BoE and thus would be correct in showing the net debt as about 65% of GDP (and actually falling slightly). Maybe you could lodge a complaint with them and ONS? I believe ONS does get this right when they do the Full Government accounts but they only come out around two years in arrears.
Indeed
They mean net of deposit balances the government might hold
Well business is booming here in Jersey Richard.
We actually need more people to work in the Finance Industry if you know of anybody…?
Cheers.
You keep saying such things
The stats never support it though
Love the way you explained your points, gave reasons and backed them up with facts. Even I could follow this. It’s balanced and acknowledges the government has injected significant money into the economy (something good I hope we agree). More of this sort of stuff please. One question I was wondering if you knew an answer to … what does the B.O.E. actually do with the interest it gets on the Government bonds it’s holding? That must add up to quite a sum these days. Do they give it back to the treasury some how? If so that really would make QE cost free for the government.
They give it back to the Treasury….
How does income used to pay off private debt feature in the savings ratio calculation? Is it classed as consumption or as part of ‘savings’?
It is savings
Thank you, so a few months back there was a report on some households having used income they werent using to consume things they couldn’t to pay back debt. Will that have had any meaningful impact on pre covid levels of private debt or would that be completely subsumed by negative effects on people who have lost income and are probably borrowing more?
I strongly suspect the wealthy are saving more and the rest may be no better off
Do you think there’s much chance these extra private savings will be spent at some point and hence lead to some consumer price inflation?
Not for some time to come – because the savings are very largely by the already wealthy and they don’t spend
[…] the savings rate has shot up because of the .coronavirus […]