The myth
We have to repay the national debt.
Reply
The reply - 1
We never have! It's been rising almost constantly since it began. Why should we start repaying it now?
The reply - 2
You do know that the national debt includes all our notes and coins? Why do you want to get rid of them?
The reply - 3
£167 billion of National Savings & Investments accounts is included in national debt. Do you want to close NS&I? If so, why?
The reply - 4
You do know that the national debt is just banks, pension funds, life assurance companies, companies and even some individuals just saving in the safest place that they can? Why do you want to take those safe savings accounts away from people?
The reply - 5
You do know that the interest rate on the national debt is negative right now? People are paying the government to take their money? Why would you want to stop that?
Some data
Since 1946 the UK government has increased what is called the UK national debt by £1,782 billion.
In that same 74 year period the UK government repaid just £38 billion of the national debt.
As a matter of fact we have repaid almost none of our national debt over the last 74 years. So why does anyone think we should start doing so now?
And there are £71 billion of bank notes in circulation and a bit less than £5 billion in coins. These are all part of the national debt - the notes even have the fact printed on them. Why do we want to get rid of all these, which we would if we repaid the national debt?
National Savings and Investments - including Premium Bonds - is also part of the national debt. Why do you want to close that? £167 billion was held in their accounts by 25 million customers according to their last accounts.
And gilts are really just another sort of term deposit savings account used by pension funds, Life assurance companies, banks, companies and even some people. Why do you want to close these ultra-safe accounts and make pensions and savings more vulnerable?
The evidence
Since 1946 the UK government has increased what's called the UK national debt by £1,782 billion. To put that in context, the UK had total national income of about £2,200 billion on 2019/20.
In that same 74 year period from 1946 t0 2020 the UK government repaid just £38 billion of the national debt.
In the same period the UK's national income grew, in 2020 prices to make the comparison fair, from £393 billion in 1946 to £2,200 billion in 2019/20. That is an equivalent of an increase from £7,900 per person in 1946 to about £33,300 in 2019/20.
Data evidences these facts. UK net national borrowing each year, in original prices, was as follows from 1946 to date, split into two columns to show the years when there was borrowing and the years when there were repayments.
Repayments only took place in eleven years.
The evidence that there has been any effort to repay national debt is very hard to find:
| Year | Overall net borrowing | Borrowed | Repaid |
| £'bn | £'bn | £'bn | |
| 1946/47 | 0.6 | 0.6 | 0.0 |
| 1947/48 | 0.1 | 0.1 | 0.0 |
| 1948/49 | -0.5 | 0 | -0.5 |
| 1949/50 | -0.6 | 0 | -0.6 |
| 1950/51 | -0.5 | 0 | -0.5 |
| 1951/52 | -0.1 | 0 | -0.1 |
| 1952/53 | 0.2 | 0.2 | 0.0 |
| 1953/54 | 0.4 | 0.4 | 0.0 |
| 1954/55 | 0.3 | 0.3 | 0.0 |
| 1955/56 | 0 | 0 | 0.0 |
| 1956/57 | 0.1 | 0.1 | 0.0 |
| 1957/58 | 0 | 0 | 0.0 |
| 1958/59 | 0.1 | 0.1 | 0.0 |
| 1959/60 | 0.6 | 0.6 | 0.0 |
| 1960/61 | 0.7 | 0.7 | 0.0 |
| 1961/62 | 0.6 | 0.6 | 0.0 |
| 1962/63 | 0.5 | 0.5 | 0.0 |
| 1963/64 | 0.9 | 0.9 | 0.0 |
| 1964/65 | 0.7 | 0.7 | 0.0 |
| 1965/66 | 0.6 | 0.6 | 0.0 |
| 1966/67 | 1 | 1 | 0.0 |
| 1967/68 | 1.6 | 1.6 | 0.0 |
| 1968/69 | 0.3 | 0.3 | 0.0 |
| 1969/70 | -0.9 | 0 | -0.9 |
| 1970/71 | -0.3 | 0 | -0.3 |
| 1971/72 | 0.6 | 0.6 | 0.0 |
| 1972/73 | 1.9 | 1.9 | 0.0 |
| 1973/74 | 3.4 | 3.4 | 0.0 |
| 1974/75 | 5.6 | 5.6 | 0.0 |
| 1975/76 | 7.7 | 7.7 | 0.0 |
| 1976/77 | 7 | 7 | 0.0 |
| 1977/78 | 6.4 | 6.4 | 0.0 |
| 1978/79 | 8.7 | 8.7 | 0.0 |
| 1979/80 | 8.5 | 8.5 | 0.0 |
| 1980/81 | 11.5 | 11.5 | 0.0 |
| 1981/82 | 6 | 6 | 0.0 |
| 1982/83 | 8.5 | 8.5 | 0.0 |
| 1983/84 | 11.8 | 11.8 | 0.0 |
| 1984/85 | 12.5 | 12.5 | 0.0 |
| 1985/86 | 9 | 9 | 0.0 |
| 1986/87 | 8.4 | 8.4 | 0.0 |
| 1987/88 | 4.7 | 4.7 | 0.0 |
| 1988/89 | -6 | 0 | -6.0 |
| 1989/90 | -0.6 | 0 | -0.6 |
| 1990/91 | 6.2 | 6.2 | 0.0 |
| 1991/92 | 23 | 23 | 0.0 |
| 1992/93 | 47.1 | 47.1 | 0.0 |
| 1993/94 | 51.6 | 51.6 | 0.0 |
| 1994/95 | 43.8 | 43.8 | 0.0 |
| 1995/96 | 35.3 | 35.3 | 0.0 |
| 1996/97 | 27.7 | 27.7 | 0.0 |
| 1997/98 | 9.3 | 9.3 | 0.0 |
| 1998/99 | -1 | 0 | -1.0 |
| 1999/00 | -11.4 | 0 | -11.4 |
| 2000/01 | -15.7 | 0 | -15.7 |
| 2001/02 | 5.4 | 5.4 | 0.0 |
| 2002/03 | 34.1 | 34.1 | 0.0 |
| 2003/04 | 41.7 | 41.7 | 0.0 |
| 2004/05 | 49.2 | 49.2 | 0.0 |
| 2005/06 | 44.3 | 44.3 | 0.0 |
| 2006/07 | 40 | 40 | 0.0 |
| 2007/08 | 45.7 | 45.7 | 0.0 |
| 2008/09 | 117.9 | 117.9 | 0.0 |
| 2009/10 | 158.3 | 158.3 | 0.0 |
| 2010/11 | 140.4 | 140.4 | 0.0 |
| 2011/12 | 122.2 | 122.2 | 0.0 |
| 2012/13 | 125.4 | 125.4 | 0.0 |
| 2013/14 | 105.5 | 105.5 | 0.0 |
| 2014/15 | 96.9 | 96.9 | 0.0 |
| 2015/16 | 81.1 | 81.1 | 0.0 |
| 2016/17 | 56.1 | 56.1 | 0.0 |
| 2017/18 | 56.5 | 56.5 | 0.0 |
| 2018/19 | 38.4 | 38.4 | 0.0 |
| 2019/20 | 47.6 | 47.6 | 0.0 |
| Totals | 1744.6 | 1782.2 | -37.6 |
A chart of this data looks like this:
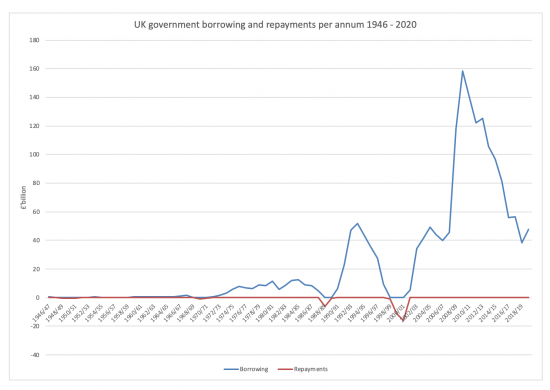
As is apparent, borrowing is normal and repayment is rare, and in much smaller amount.
This data came from the House of Commons library. Most other economic data is from the Office for Budget Responsibility. Population data is from the Office for National Statistics, over various releases of which the main one is here.
And as for who owns the debt, The House of Commons Library suggests it was as follows in late 2018. The proportion of bond debt owned by the government will now have gone up as it has bought another £200 billion of its own debt as the coronavirus crisis has developed:
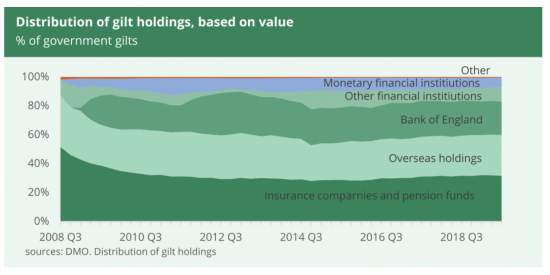
What this makes clear is that around a quarter of the debt (the part-owned by the government )has no interest paid on it and of the rest, two thirds is in the UK.
The only reasonable conclusion is that there is no reason at all to think that the national debt need be repaid based on the evidence of the period since World War II. In that case to suggest that it should be now makes no sense at all. The debt will remain outstanding, as has that from all previous periods.
_______________
There are more Mythbusters here.
Thanks for reading this post.
You can share this post on social media of your choice by clicking these icons:
You can subscribe to this blog's daily email here.
And if you would like to support this blog you can, here:


There is something missing from the second last para under the green chart.
I usually make the point that it is all part of a double-entry accounts system and that what is called the National Debt on the government side of the balance sheet is also the National Savings when seen from the private sector side. I would suggest being a bit more explicit that total repayment of the debt would mean absolutely no UK currency for anyone. I guess Zimbabwe managed to repay its National Debt …
Warren Mosler prefers to describe government bonds as being a term deposit savings account at the Central Bank, with the only difference to a normal savings account being that you can sell your ownership of the account in the secondary market. When one of these is repaid then the money is simply transferred out of the term deposit account and into your commercial bank’s reserve account instead (which means there is no economic effect at all from this particular transaction). However what it is repaid with does matter – so either the government would levy tax to the equivalent value so that although the owner of the bond now has cash in their bank, money to the value of the bond was taxed from everyone collectively and destroyed, or the government spends additional money to repay the bond by creating more notes or running up its overdraft at the central bank. In the second case although the bond was repaid the National Debt would not change as the new money would simply replace the repaid bond as a component of the Debt. Route 1 would therefore reach the logical conclusion of no money in circulation as it would all have been taxed away, while Route 2 would repay all the bonds but leave the National Debt unchanged as all bonds would simply have been turned into cash instead.
the anomaly for debt borrowed and returned for 99/2000,what happened there apart from the obvious,and why did they pay it back if the preferred route is not to?
They sold 4g licences …
Very well explained Richard, together with all the supporting evidence. Many thanks. What a refreshing change from the usual servings of illiterate drivel that the 1% and their fellow travelers dish up.
Thanks
Richard,
May I suggest then when this series of Mythbusters posts is complete, they be brought together into a booklet (actually, more likely a full book) entitled:
“Essential Reading for Would-be MP’s”
Further, that same book should, by force of legislation, be given to all would-be MP’s to read, after which, again backed by legislation, they would be required to pass an exam (with due accommodation for dyslexic, blind or otherwise disabled candidates) that showed up they had acquired sufficient understanding of the matters contained in the book to be allowed to stand as an MP.
Of course, those of different political and economic persuasions could always exercise their intellects to refute the arguments contained in the book, but we, the electors, would have a far better chance of being represented by people who did not endlessly repeat the utter drivel we’ve had to listen to for 40+ years (probably since Callaghan’s speech to the Labour Party Conference in 1976, that you can’t spend your way out of a recession), but who, instead, engaged in truly informed debate in the Chamber, and elsewhere.
And, of course, the voters could also read it, and make up their minds on the arguments – AND evidence, a most important component – presented therein.
Let’s see how this develops
Overseas holdings in the graphic? Is this for states that trade internationally in Sterling? Or just savings by people and companies based overseas?
Both
Very good. Some short summary points along with more detailed explanations.
Thank you.
Replies 3 and 4 will not be obvious to many people and maybe its needs some sort of statement about why savings with the government are considered as part of the debt.
“Notionally all the savings could be withdrawn and then the government would have to repay them, so its considered to be a debt, but in practice saving with the government is the safest place there is and any repayments are [always?] replaced by new savings.”
I know what I’ve suggested reduces the directness and simplicity of your replies, but if the target audience includes the general public, then I feel something else is need.
There’s something missing from your penultimate paragraph.
Last one dealt with
I’ve tried the first tweet out live – and it works well
The penultimate paragraph (‘What this makes clear is that around a quarter of the debt (the part-owned ‘) seems to be only half there – what is made clear?
Sorry – no idea how that happened
Corrected now
Is there something missing from the 2nd last para?
Corrected now
The sentence below the final graphic just tails off into the void: “What this makes clear is that around a quarter of the debt (the part-owned” …
Corrected now
Not sure what happened there
It’s amazing how many people don’t know how government borrowing occurs.
People worry about excessively borrowing – what sort of real-world impacts does this have? Most of borrowing isn’t from taxation so they shouldn’t justify tax rises because of this, right? Another argument I hear is people talk about inflation in relation to QE. And also, I read that people are basically giving the government money so they can borrow. Have I misinterpreted, and if not why would this be the case?
I want to become an expert on this topic to fend off the post corona arguments…
thank you!
So, why is it called ‘debt’ then?
As you can see, I’ve dedicated myself to be as stupid as I can be if only to drill down into these issues. I hope that I am not becoming a pain in the arse. I’m being stupid for the right reasons.
It’s the abuse or the the limitations of language in describing this stuff that worries me.
Thanks.
It isn’t debt – the language is wrong
It is a debt – a sum of money owed – but payable in sterling, which is another UK government debt instrument. It is a peculiar sort of debt that can only be satisfied by giving the holder another debt owed by the same person.
Is this maybe the key to everything (for us plebs?).
The National Debt is not a debt, the word is wrong, it should be called the National Credit?
I prefer National Savings
Pilgrim Slight Return,
You may recall an earlier post of mine, about an expert acquaintance of mine who said it should be called the National Credit.
Indeed
Aaaah – yes! – The National Credit – that’ll hit the naysayers right where it hurts – in the goolies. I like it Andrew.
The injustice of using the word ‘debt’ is that the money concerned is being used for socially useful purposes and not just speculation as we see in Shity (sic). I see this money as ‘investment’. Something that is not a millstone around future generations necks but counts more as an endowment?
Indeed…
@PSR it isn’t ALL called debt – some of it’s called National Savings and Investments
How very strange…
Yes, because if someone is spending, someone else has to save?
The debt as they call is just a ledger line – just a record of the money that has been spent (invested) and not actually ‘debt’ and the NS&I bit is the counter party to the promise?
I suppose it is about segmenting – slicing up the ‘investment cake’ and the naming of parts what the slices make it up.
Thank you Peter.
A very good explanation. Thank you.
I note there are still questions about foreign holdings of Gilts…. and they all revolve around the fear that “if we do something silly they will take their money away with them and leave us in the lurch”.
So, how are these foreigners that own gilts? It is not easy to get the data* but here is one thought…..
Foreigners own about £500bn in gilts. IMF data says that Central Banks around the world hold about £400bn in Sterling FX reserves. Most of that will be in Gilts (they are, after all, their FX Reserves and must be held in very liquid assets). The mix of FX reserves does not change much year top year (or even decade to decade) so the idea that these gilts are held in ‘weak hands’ that will sell at a drop of a hat is wrong.
Also, there will be foreigners that have Sterling liabilities who are ‘natural’ holders of gilts. For example Captive Insurance Companies. What are they? well, large companies in effect set up their own insurance company to insure against risks that they run and these are usually based in Bermuda. If they have UK risk then, no doubt, they will have Sterling assets against that risk and that will include gilts. In short, some of these foreigners are only technically foreign and are natural holders of gilts.
When Mark Carney spoke of “the kindness of strangers” in relation to the UK financing itself (in relation to Brexit) it was directed at the private sector (where foreign investors are more ‘flighty’) and not really relevant to the gilt market (where foreign holders are more ‘solid’).
* Richard, you might know where this data resides
I have looked into that data and the fact is that unless you’re Clearstream it seems you do not know
And they don’t say
I find that quite worrying on such a strategically important issue
I strongly suspect your analysis is correct – as is its solidity
Hi Clive, Mark Carney and his ‘kindness of foreigners’ quote were talking about the other deficit, the one the UK government prefers to keep well hidden. On the gilts front people can’t take their sterling out of sterling, they can only sell the sterling on the FX market. Yes that could push the pound down, but the buyer of the sterling will have the same issue of what to do with it, so as a bank account is only insured to £80k they might well just put it back into a gilt. That is why the trillion or more dollars the Chinese are sitting on is not really a problem for the US. Sooner or later the Chinese will have to use it to buy US goods or services as that is the only real way to ‘take it back home’. The other deficit is the trade deficit (currently around £150 billion pa – the worst ever I believe). That does have to be financed by selling UK plc assets (the Shard, 50% of Verizon, etc), or borrowing from foreigners. BMW have to be paid in Euro and not sterling.
This is an interesting dialogue between Mr Parry and Dr Rideout, if I may say.
This is for both Richard and Tim Rideout.
I think possibly, Tim, you spoke at an event in Glasgow on MMT with Warren Mosler and Bill Mitchell.
I‘m sure both WM and BM take the point of view that regarding exports, imports and balance of payments, the country holding the real physical goods is the country in the better position, and the other countr(ies) only have claims on financial assets.
Firstly I apologise if this isn’t a correct summary of this, as I am struggling to grasp the full idea.
So, could you comment on their idea on this? Also, what can a country do if another country owes it money for these goods?
I’m sorry that this isn’t a clear comment. I struggle understanding how the imports/exports affects the economy.
Thanks.
Tim?
Yes I did a talk in Glasgow with Bill and Warren. It took me a while to get my head around the imports / exports issue. Basically they say forget the money and consider ‘stuff’. What we want is more stuff, therefore imports are good and exports are bad. Now of course that is collectively and therefore as a country you should aim to export as little as possible to get the most imports of what you desire.
However exports are of course good for the exporters accumulating money whether foreign or domestic. Every bottle of single malt exported, though, is a bottle I can’t drink. So if you run an enormous surplus like Germany what you are really doing is suppressing domestic demand in ordet to free up stuff to export, thus allowing the exporting companies or people to accumulate financial assets. It increases wealth of a few at the expense of the lifestyle of the many.
In the case of the UK and USA then a deficit is in some ways good. It means we are taking stuff off foreigners and giving them an iou instead. The problem comes if they refuse the iou or demand we redeem the previous ones.
As Warren pointed when Caesar conquered Gaul he shipped all the stuff to Rome. He didn’t ship the stuff in Rome to Gaul in exchange for some ious from Vercingetorix.
Thanks Tim
Could I follow this up Dr Rideout? I note your remark about the complexities of import/export. Let me hypothesise an independent Scotland. Scotland could not consume the whisky it exports (!). At the same time it would wish foreign currency so that it could purchase (at a viable price) the imports that it does want. There is an exchange, a trade off in wants here. US exceptionalism and the ‘almighty dollar’ places the US in a quite distinct category. These remarks are tenative, but I would be interest in a response.
The penultimate paragraph appears to have some no doubt pithy text missing from the end. Will be interested to read the full version.
Is it really the national debt? Isn’t it the U.K. government’s debt? Is anyone really going to be asking me to pay my share off as one sixtyfifth millionth part of the nation? If not I suggest your next question of the day should be what is a better name for the “national debt”.
It’s been added
The national debt issue is being drafted….
Nice succint summary of clear arguments.
Shame almost all ecnonomic correspondents in media are ignorant of this and routinely mislead us all by parroting ideological arguments.
Some minor suggestions comments:
Present ‘debt’ as proportion of GDP instead?
Only real ‘cost’ of debt is/are interest repayments (and of these only these not to ourselves). As you point out currently the latest gilt offerings are at slightly negative rates. But even the other gilts only offer low % rates at the end of 3 or 5 year terms so repayments historically extremely low. And likely to stay very low for foreseeable future.
Is there an argument to rename ‘debt’ excluding foreign bought gilts as the ‘sum of UK assets’? Call this proportion ‘total UK assets’: pension fund, insurance ££.
Sentence near the end stops abruptly ‘What this makes clear is that around a quarter of the debt (the part-owned
I guess this is about the fact that we owe ourselves around 75% of UK ‘debt’.
One on interest coming by tomorrow….
Excellent! Small correction needed here –
“As a matter of fact we have not repaid almost any of our national debt over the last 74 years.”
Suggestion –
“As a matter of fact we have repaid almost none of our national debt over the last 74 years.”
Done…
We are moving towards a cashless society; we will be unlikely to arrive there, certainly in the immediate future (and a proportion of the population – poorer or older or both – would be in very grave difficulty if cash disappeared*); but think of it as a thought experiment, with latent probablity; how would ‘household budget’ theorists (bless ’em) propose we repay the £71 Billion? What would that mean? Who pays?
*One of the features of what I think should now be termed the ‘contactless society’ (who knows their bank manager any more?), is that modern communications, in league with the banks is quite quickly reducing critical aspects of life (especially financial transactions) to a virtual non-experience; delivering us all into the escape-proof, dystopian grasp of the banks, the bankers and of surveillance capitalism. Now that really is disturbing.
You’re both cheery and challenging this pm
I should have begun by saying it was a very good summation of your concept that you have presented today; which I must confess, I was not sure where precisely you were going to go with it. Now I understand; call me slow on the uptake!
It does perhaps lend itself to a ‘Wings over Scotland’ style Wee Book, or whatever it was called.
I hope so
Hello Richard,
“Repayments only took place in seven years.”
Shouldn’t that be eleven, seven under Labour and four under the Tories?
Steve
I’ll check and change
Hi Richard, plenty of solid points, as usual in this post.
Reply number 2 is something I’ve commented on before (and did so earlier in reply to your tweet in short form. Its a perfectly fine point, but in the scheme of the things, the notes and coins are trivial
The bigger issue for me though is its only really by convention that notes and coins are liabilities at all – and a hangover from the gold standard, when notes and coins were (theoretically) convertible for gold with the Bank of England (that’s what all the “I promise to pay the bearer on demand” stuff is referring to). In national accounts, and in monetary and financial statistics and in International Public Sector Accounting Standards, Gold is treated as a financial asset but its not anyone’s liability – I think it would make more sense in a fiat currency world to treat notes and coins just like gold – as a financial asset for the holder, but not as a liability.
I suspect eventually technology will render the point void, as the amount of currency in circulation shrinks and more transactions take place electronically (I’ve not withdrawn any cash at all since the lockdown started in March) but there are some economies which, for cultural and other reasons (Hello Japan), have a large volume of notes and coins in circulation in % of GD, but I think its very odd to add that to public sector debt measures when these liabilities ultimately never have to be repaid.
Where is the credit then?
“it would make more sense…to treat notes and coins…as a financial asset for the holder, but not as a liability.”
That makes no sense. All money is an IOU. And IOUs are only an asset at all because the issuer has promised you something nice in return. If the issuer gives you an IOU that promises you nothing whatsoever (i.e. issuer has no liability), then the IOU is worthless.
The notes are always a liability
The note is not an asset
It is a mere token that represents an asset
The asset is the promise to pay
Richard
Excellent, succinct, clear, indisputable.
Accountant here, I work in restructuring and insolvency and am already alarmed by the number of professionals concerned about “how its all going to be paid back.”
Concerning, but now I have something to prove they needn’t be worried.
Well done!
There is more to come….
So, in simple terms it’s the same as me borrowing ad infinitum from my bank and having a very good lifestyle. Until the bank loses faith in my ability to repay. Everybody is happy until one party is not happy.
Not at all…..
Look at the data on debt interest I’ll publish tomorrow
There is no hint of borrowing without limit
And MMT says nothing of the sort….
It says money can only be created until full employment is reached
There is a very real limit
That’s an interesting thought.
So, because we have just increased unemployment by a huge amount by deliberately killing the economy we can therefore borrow a huge amount more. It is in the government’s interest to create unemployment in order to increase spending?
I don’t necessarily disagree with your philosophy I just don’t quite get it. I do apologise if you think I am stupid.
No!
It is never in the government’s interests to create unemployment
It’s job is to create full employment
AN external event has prevented that
It is the government’s job to address the economic fall out
And borrowing has no virtue in itself – it’s just a tool
I admit I do not understand your incomprehension
My logic is very clear: I want a vibrant, long term sustainable economy in which all who want to can work and are able to afford to live on the wage that they earn
I am an accountant not an economist, so I come at these thought processes coloured by the jargon of my trade.
For example, I am delighted that national “debt” has increased and is rarely repaid as I conceive that this debt is actually capital. In balance sheet parlance does it not represent the monetary value of net UK assets?
Repayment of this capital is a ridiculous proposition. It’s akin to suggesting that it would be a great idea for all trading companies to repay their capital to shareholders. How would the company have the means to continue in trade without their assets, presumably sold to provide the resources to repay their capital?
As a non-economist, but with a keen interest in the matters posted on this blog, I am still concerned that even your eloquent simplifications still require a quantum leap in comprehension to “understand” the real nature of the abstract world of money.
For example, I have friends who will not budge on their understanding of the debt proposition. We have to pay for this. Where is the money coming from? Etc, etc.
The glassy-eyed stares that my feeble attempts at explanation create Do not pass muster in competition with the drivel on these topics repeated by politicians, economists who should know better, press commentators and, God forbid, the Chancellor.
Debt is debt. What we have is a stand-off. On one side belief that national capital can be repaid without reducing national assets to zero, and on the other side, the voices of reason that this is clearly a non-sensical point of view.
Double entry rules, OK?
Surely what we need is a convert? An institution or person(s) who have seen the light and whose conversion will be noticed. Seems to me that most of the folks who contribute to this blog are engaging in this break-through process.
But CHancellor Sunak and his buddies still assert the king has new clothes, when clearly, those who have removed their virtual reality goggles can see the naked reality.
I hope my ramblings are useful Richard. You and your contributors pose urgent questions and your daily commitment expanding this debate is extraordinary.
I can’t help but think that the real term for the national debt is the ‘national capital’
Credits on the balance sheet are liabilities or quity
Why the heck isn’t this equity?
[…] Mythbuster: We have to repay the national debt […]
“… money can only be created until full employment is reached.”
Before the pandemic the UK was close to full employment and dependant on immigration and transient foreign workers to get things done. Did this then place a constraint on the creation of money to fund infrastructure projects? This would make sense if, in reality, a workforce could not be found for those projects without fierce competition in the labour market.
And, is labour the only resource the scarcity of which would place a constraint on money creation? What about International competition to access essential raw materials, e.g.. cement and steel, for which the the UK is not self-sufficient?
My concern in posing these, possibly naive, questions is for the funding of any Green New Deal that itself creates full employment.
Yes, in a word
Full employment is the constraint
But we did not have it
We had maybe 5 million underemployed people before this began
That’s not full employment and explained stagnant wages
The sustainability constraint has to be imposed
A small point.
Would it be better to say “Do you want to …………” rather than “Why would you….”
It seems a little aggressive to suggest that your correspondent is ignorant, even though by definition he probably is!
Noted….
It’s more than a “small point”, I think. Too many “debates” quickly descend into mud-slinging and stasis. The opposing sides delight in taking a tone that suggests the other side are complete idiots, plain evil, or whatever (Brexit, HS2 etc.). The stuff on this site is far too important for that. The interlocutor needs to be invited in by the language used, not repelled or provoked to put up the barricades.
Something like…
We never have. It’s been rising almost constantly since it began and there doesn’t appear to be a particular reason to start repaying it now.
The reply – 2
The national debt includes all our notes and coins. We still need these.
The reply – 3
£167 billion of National Savings & Investments accounts is included in national debt. A lot of savers value NS&I, so there would have to be a very good reason to close it down.
….. oh, and instead of national debt, how about trying to extend the use of a term that is reasonably familiar and has positive connotations, and start calling it the “national savings and investment account”.
All noted
Especially re tone
I will bear this in mind
I am coming back on the language of national debt issue, soon
Incidentally, from a quick scan of the historical borrowing record that Richard listed above, it looks as though, to a rough approximation, Tory governments have borrowed about twice as much as Labour over the last 75 years.
Some might say not too surprising as they have been in office about 60% of the time. But perhaps more surprising, Labour governments seem to have repaid about four times the amount that Tories have over the same period, despite only being in office 40% of the time.
Does my reckoning match with yours on this Richard? If correct, it seems to somewhat undermine the rather dominant myth of Labour profligacy!
Try this
https://www.taxresearch.org.uk/Blog/2020/05/14/the-tories-are-the-biggest-government-borrowers-since-1946/
Thanks Richard
I missed that one unfortunately. You are so prolific, I can’t’ always keep up.
Me neither, sometimes
What’s so frustrating is that the reality is there in front of us for all to see and yet there isn’t a single chancellor shouting it from the rooftops!
Whenever you hear someone banging on about paying it back it’s a red flag for either incompetence or dishonesty.
You can watch the narrative be they politician or journalist and you can see how vacuous they are because they are devoid of any actual argument as to why. They either don’t know or don’t want us to know. Either way it means they are unfit to hold their post.
There’s always an agenda and sadly that seems to be to screw everyone and steal what they can before the pitchforks come out.
I see there’s been yet another Twitter spat, where the usual suspects raise the spectre of MMT being against borrowing. The claims seem to be that MMT is against issuing bonds to “balance the books”, we can’t trust “dodgy governments”, and must put our faith in Central Banks.
Are they still trying to defend the FCR, which required belief in Central Bank independence and borrowing? Do they like the concept of “mounting debt” to put a constraint on spending?
I appreciate that there are technical niceties around this debate, which I’m not qualified to discuss. However, it’s clear the Central Bank lovers are misquoting the MMT literature when they claim that they are all against borrowing. Anyway, Central Bank independence is a bit of a mirage.
On their central point, is there a clear example of a dodgy government getting a country into trouble by using direct monetary financing without borrowing to “balance the books”?
MMT says borrowing is a choice
I hope to address this in a myth tomorrow on MMT….but I have other things to do with sons this pm, so will see if I get there